Tailored forecasts for MAM
Why tailored forecasts work so well for the eastern Horn of Africa March-to-May rainy season
by Chris Funk and Laura Harrison
Introduction
As East Africa struggles to cope with the disastrous impact of three sequential droughts, and a potential fourth poor March-April-May (MAM) 2022 long rains season, it is important to leverage scientific discoveries from previous research, and take advantage of the opportunities that tailored forecasts provide for anticipating droughts in the eastern Horn of Africa (EHoA). Here, we define the EHoA as the parts of Ethiopia, Kenya, and Somalia south of 8N and east of 38E. This region sits under the descending branch of the Indian Ocean Walker Circulation, which provides a connection to impacts related to Pacific Ocean sea surface temperature conditions, which in turn, sets the stage for sequential October-November-December (OND) and MAM droughts during and after La Niña events. In this post we briefly describe the main findings of this research, how it can be applied to make very successful forecasts of EHoA droughts, and why we are very concerned about a very likely fourth dry season in the coming months.
Background: Deductive and Inductive Reasoning
Before getting into specifics, it is worth reminding the readers that science typically operates in two main ways, through deductive and inductive reasoning. Both modalities are important, but sometimes one approach works better than the other.
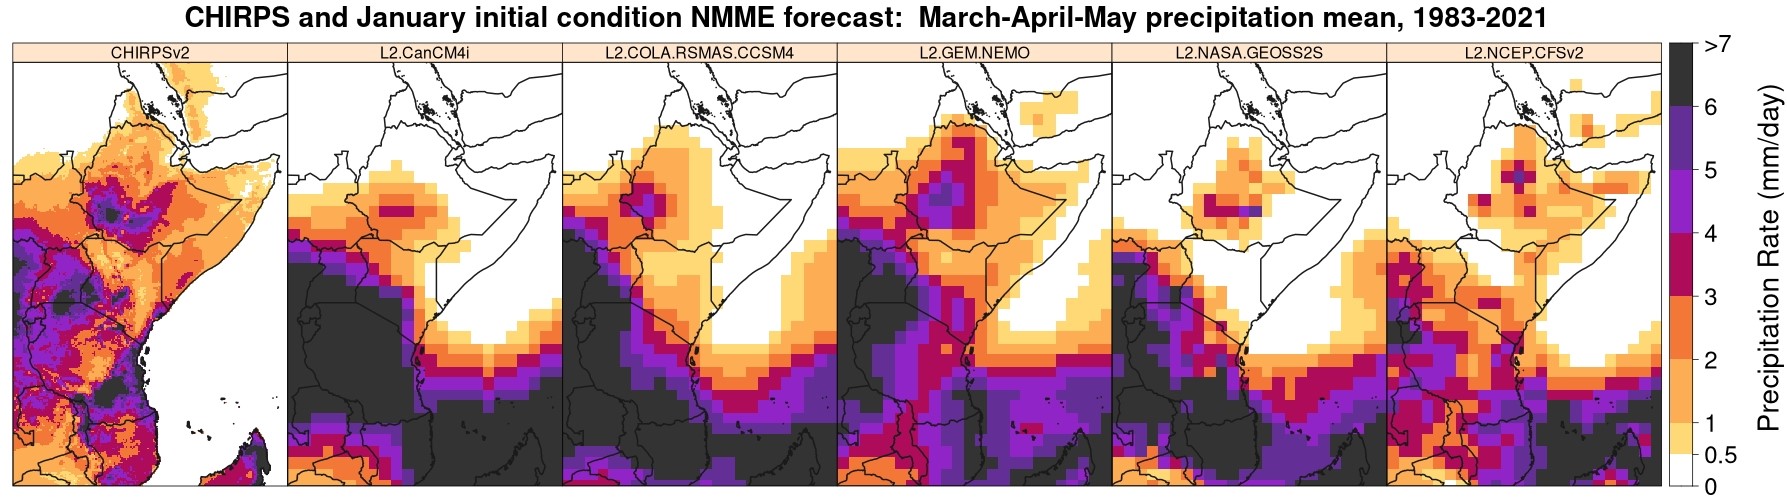
Deduction: Deduction begins with a set of assumptions, and then uses logic and mathematics to draw conclusions. Climate models are a good example of deduction. One begins with a set of assumptions (primarily, the observed conditions in the oceans), and then uses coupled ocean-atmosphere models, which incorporate physical laws and relationships, to predict what happens in the future. Climate models are powerful tools, but also face serious limitations, and these limitations are particularly severe in EHoA during the long rains. The real world is much more complex than even the most sophisticated climate model. Some climate phenomena are better represented than others. For example, during the October-November-December (OND, short) rainy season, the models tend to represent well the onshore flows of moisture from the Indian Ocean basin. This translates into a good representation of both the long term mean and year-to-year variations in the short rains, which are often related in predictable ways to El Niño, La Niña and Indian Ocean Dipole events. Unfortunately, in MAM, the models do not capture well the location of the onshore moisture transports and associated moisture convergence patterns, and tend to dramatically underestimate the rainfall intensities in the eastern Horn. Figure 1 shows the mean MAM rainfall from the CHIRPS observational data set and five North American Multi-Model Ensemble (NMME) models. Most of these models significantly underestimate MAM rainfall in Somalia, southern and eastern Ethiopia, and eastern and northern Kenya. Models tend to simulate only marginal amounts here, while in reality the season is highly important. Many areas receive around half of their annual rain during MAM. Models particularly struggle with representing observed climatology in coastal areas of southern and central Somalia. These low biases can be contrasted with the much higher amounts- and higher than realistic- modeled rainfall in areas to the west and south, over Tanzania, western Uganda, Rwanda, and Burundi. The models do not capture well the complex moisture transports and weather mechanisms that produce rainfall in EHoA. If these models struggle to simulate the mean rainfall in these regions, they will also have a lot of trouble simulating above- and below-normal rainfall anomalies. For example, if simulated rainfall in southern Ethiopia or Somalia is extremely close to zero, model forecasts of above-normal and below-normal precipitation may not be very meaningful or reliable.
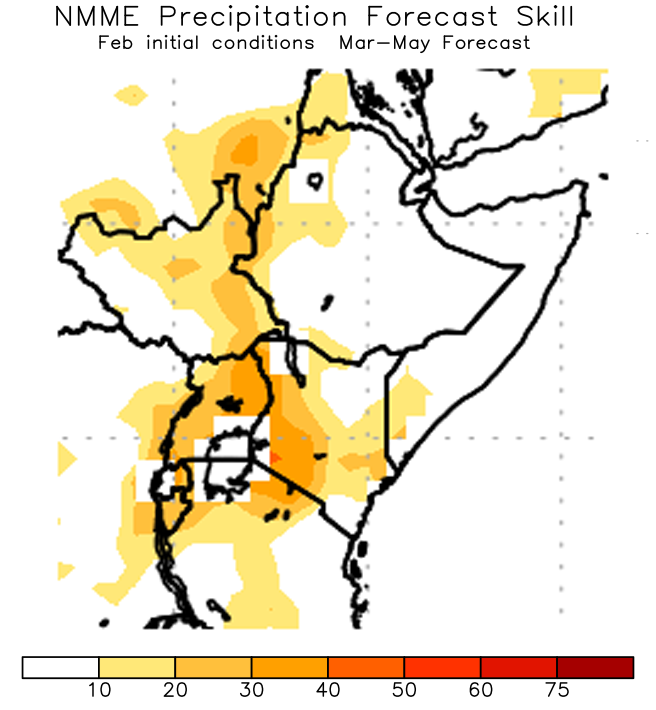
In addition to issues related to recreating mean rainfall, the models also have trouble recreating the year-to-year variations in MAM EHoA precipitation. Studies of climate model skill have previously noted the low correlation between observed MAM rains and EHoA climate model forecasts. Skill (correlation) maps are also often available from forecast providers, and should be considered when assessing the utility of climate model forecasts. See for example Climate Prediction Center (CPC) skill maps for the NMME (here). Figure 2 shows the correlation between observed MAM precipitation and ensemble average NMME precipitation forecasts made in February. Over Ethiopia, Kenya, and Somalia, these results suggest that the correlation between the multi-model NMME average is very close to zero. Caution needs to be taken when using the dynamical model forecasts of EHoA rainfall.
Induction: Luckily, science does not have to always rely on deduction. Since the early 1930s, induction has played a pivotal role in advancing early warning science. For example, it was the search to understand and predict Asian Monsoon droughts that lead to the discovery of the atmospheric Southern Oscillation, which was later connected to El Niño events in the equatorial East Pacific. By analogy, the extreme food security impacts of EHoA droughts have motivated scientists from the Famine Early Warning Systems Network (FEWS NET) to analyze, in detail, the drivers of recent East African EHoA droughts. While a detailed recounting of this work, and a more thorough review of the broader literature is beyond the scope of this post, we can list here some of the key highlights associated with FEWS NET’s research. Please note that this discussion focuses on the EHoA region, and not the broader Greater Horn of Africa. FEWS NET scientists have primarily focused on the eastern Horn, which is the region struck by recent OND 2020, MAM 2021 and OND 2021 droughts. A particular focus has been drivers linked to sequential OND/MAM droughts, MAM drying trends, and seasonal prediction. While there have been valuable recent studies highlighting the role played by the northern and southern Indian Ocean (e.g. McLeod 2019, Wainwright et al. 2019), here we will end up focusing on the Pacific, because of its links to predictable sequential droughts.
FEWS NET scientists were the first to identify the decline in the long rains, ascribing the mechanism to a stronger Indian Ocean branch of the Walker Circulation (2005, 2008). This enhancement is associated with easterward wind anomalies over the equatorial Indian Ocean, increased vertical ascent in the region around Indonesia, and increased subsidence (sinking air) over the eastern Horn of Africa and western Indian Ocean. Recent reanalysis low-level wind anomalies and equatorial vertical velocities anomalies resemble such disruptions. Eastward low level wind anomalies over the Indian Ocean tend to reduce the transport of moisture into EHoA. Increased subsidence over EHoA inhibits precipitation. It also increases air temperatures for two reasons: sinking air warms, and sinking air reduces cloudiness.
Almost 20 years later, it is probably fair to conclude that our basic hypothesis was correct, but also incomplete. While an enhanced Indian Ocean branch of the Walker Circulation has been associated with many recent EHoA droughts, we now understand that this enhancement often arises through the influence of the Pacific Ocean, as first suggested by modeling experiments by Lyon and DeWitt (2012). Under this view, a climate shift following the 1997/1998 El Niño– associated with a dramatic warming in the western Pacific – can help explain the ‘abrupt’ decline in the long rains.
As we will show, this connection opens the door to effective ‘tailored’ forecasts of EHoA MAM long rains. To start, it is important to note two important aspects of the EHoA long rains.
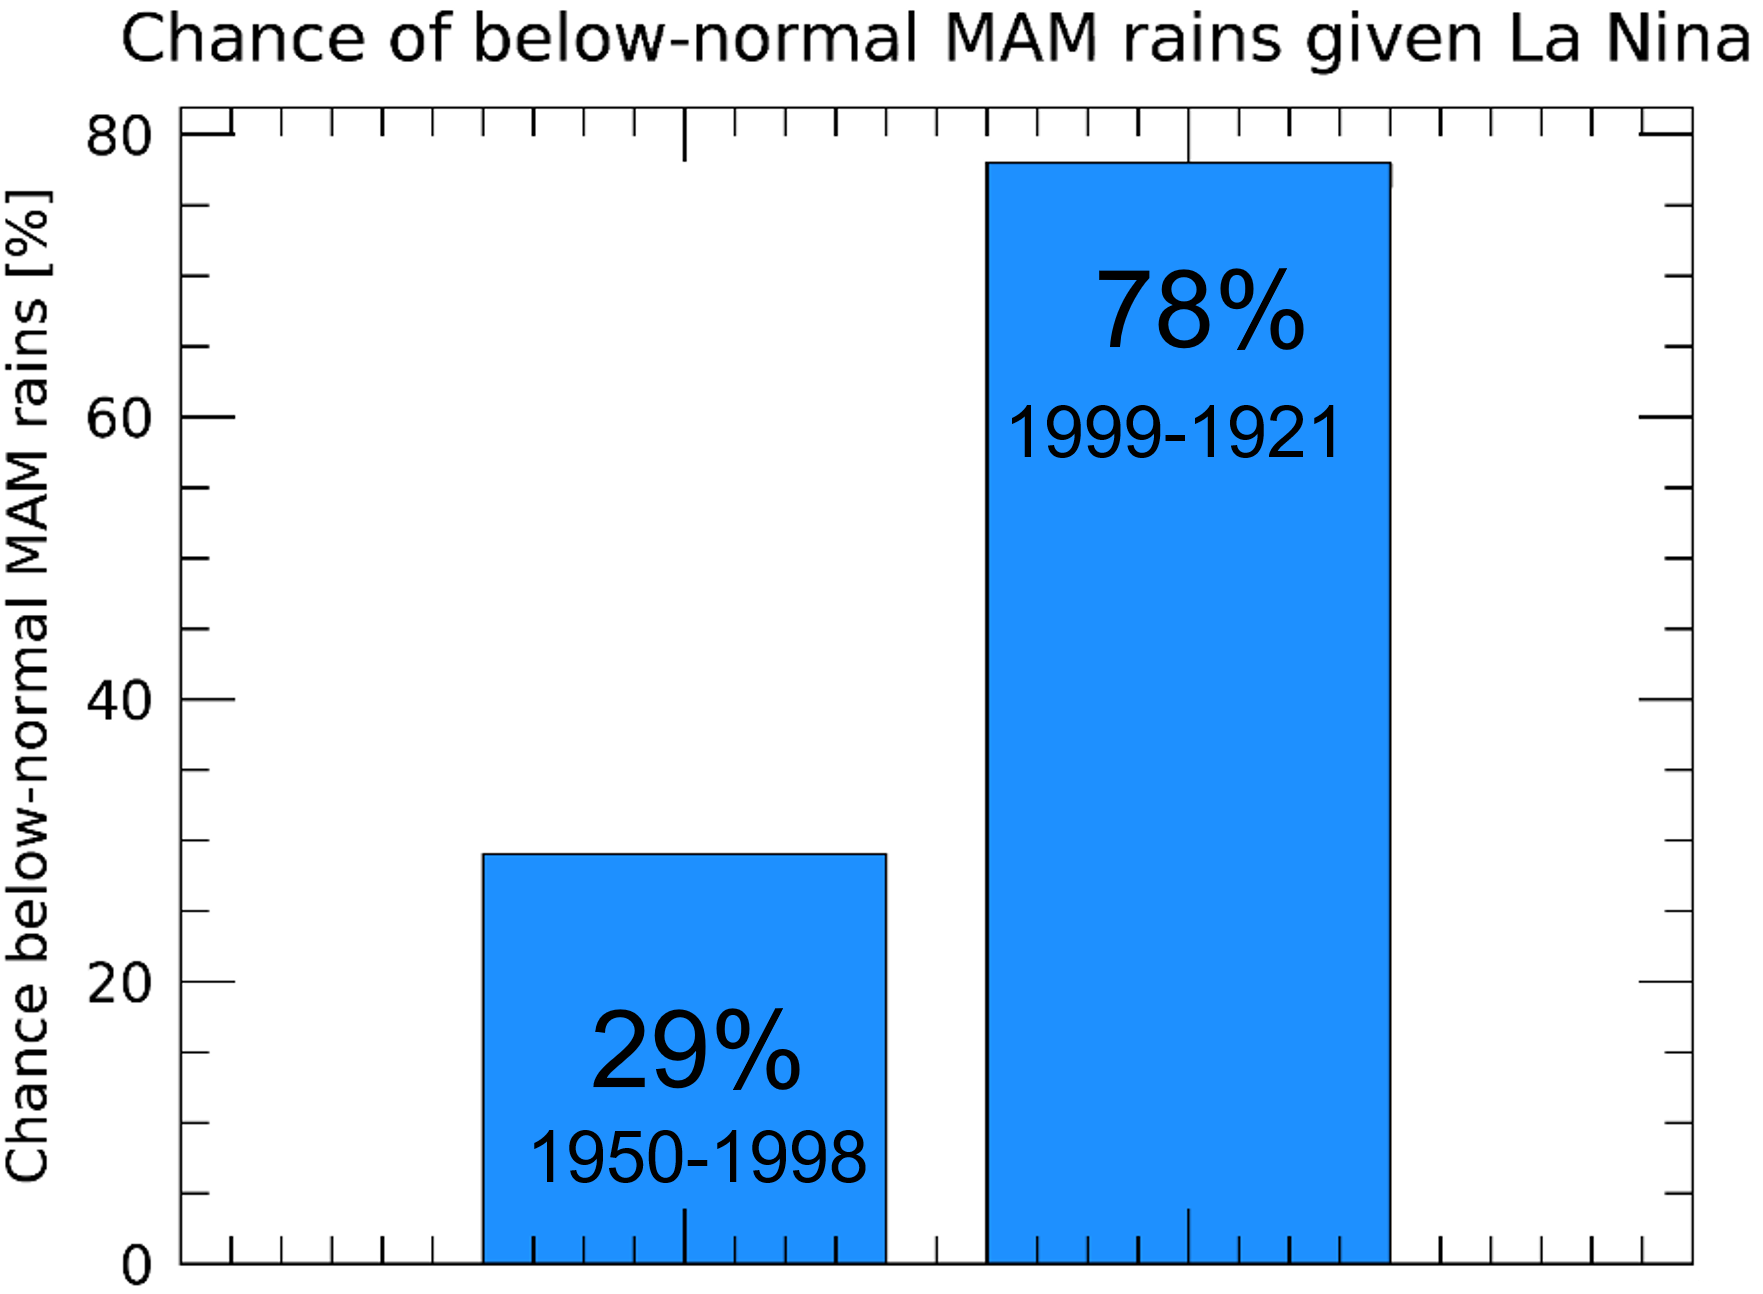
First, as shown in the December 2021 multi-agency alert and Figure 3 below, there is a much stronger link between OND La Niña events and subsequent dry MAM seasons following the post-1998 climate shift. Between 1950 and 1998, there was essentially no relationship between La Niña and MAM EHoA droughts. After the 1999 climate shift we find a very strong relationship: When La Niña conditions exist in OND, there is now a 78% chance of below-normal MAM rains. As discussed in a few papers from 2018 (QJRMS, BAMS) this increased chance of drought is associated with exceptionally warm western Pacific sea surface temperature (SST) conditions and relatively cool east Pacific temperatures. While we do not go into the climate dynamics here, the basic mechanism involves the amplification of a naturally-occurring La Niña-like Pacific Ocean SST pattern by climate change-associated warming of SSTs in the western Pacific.
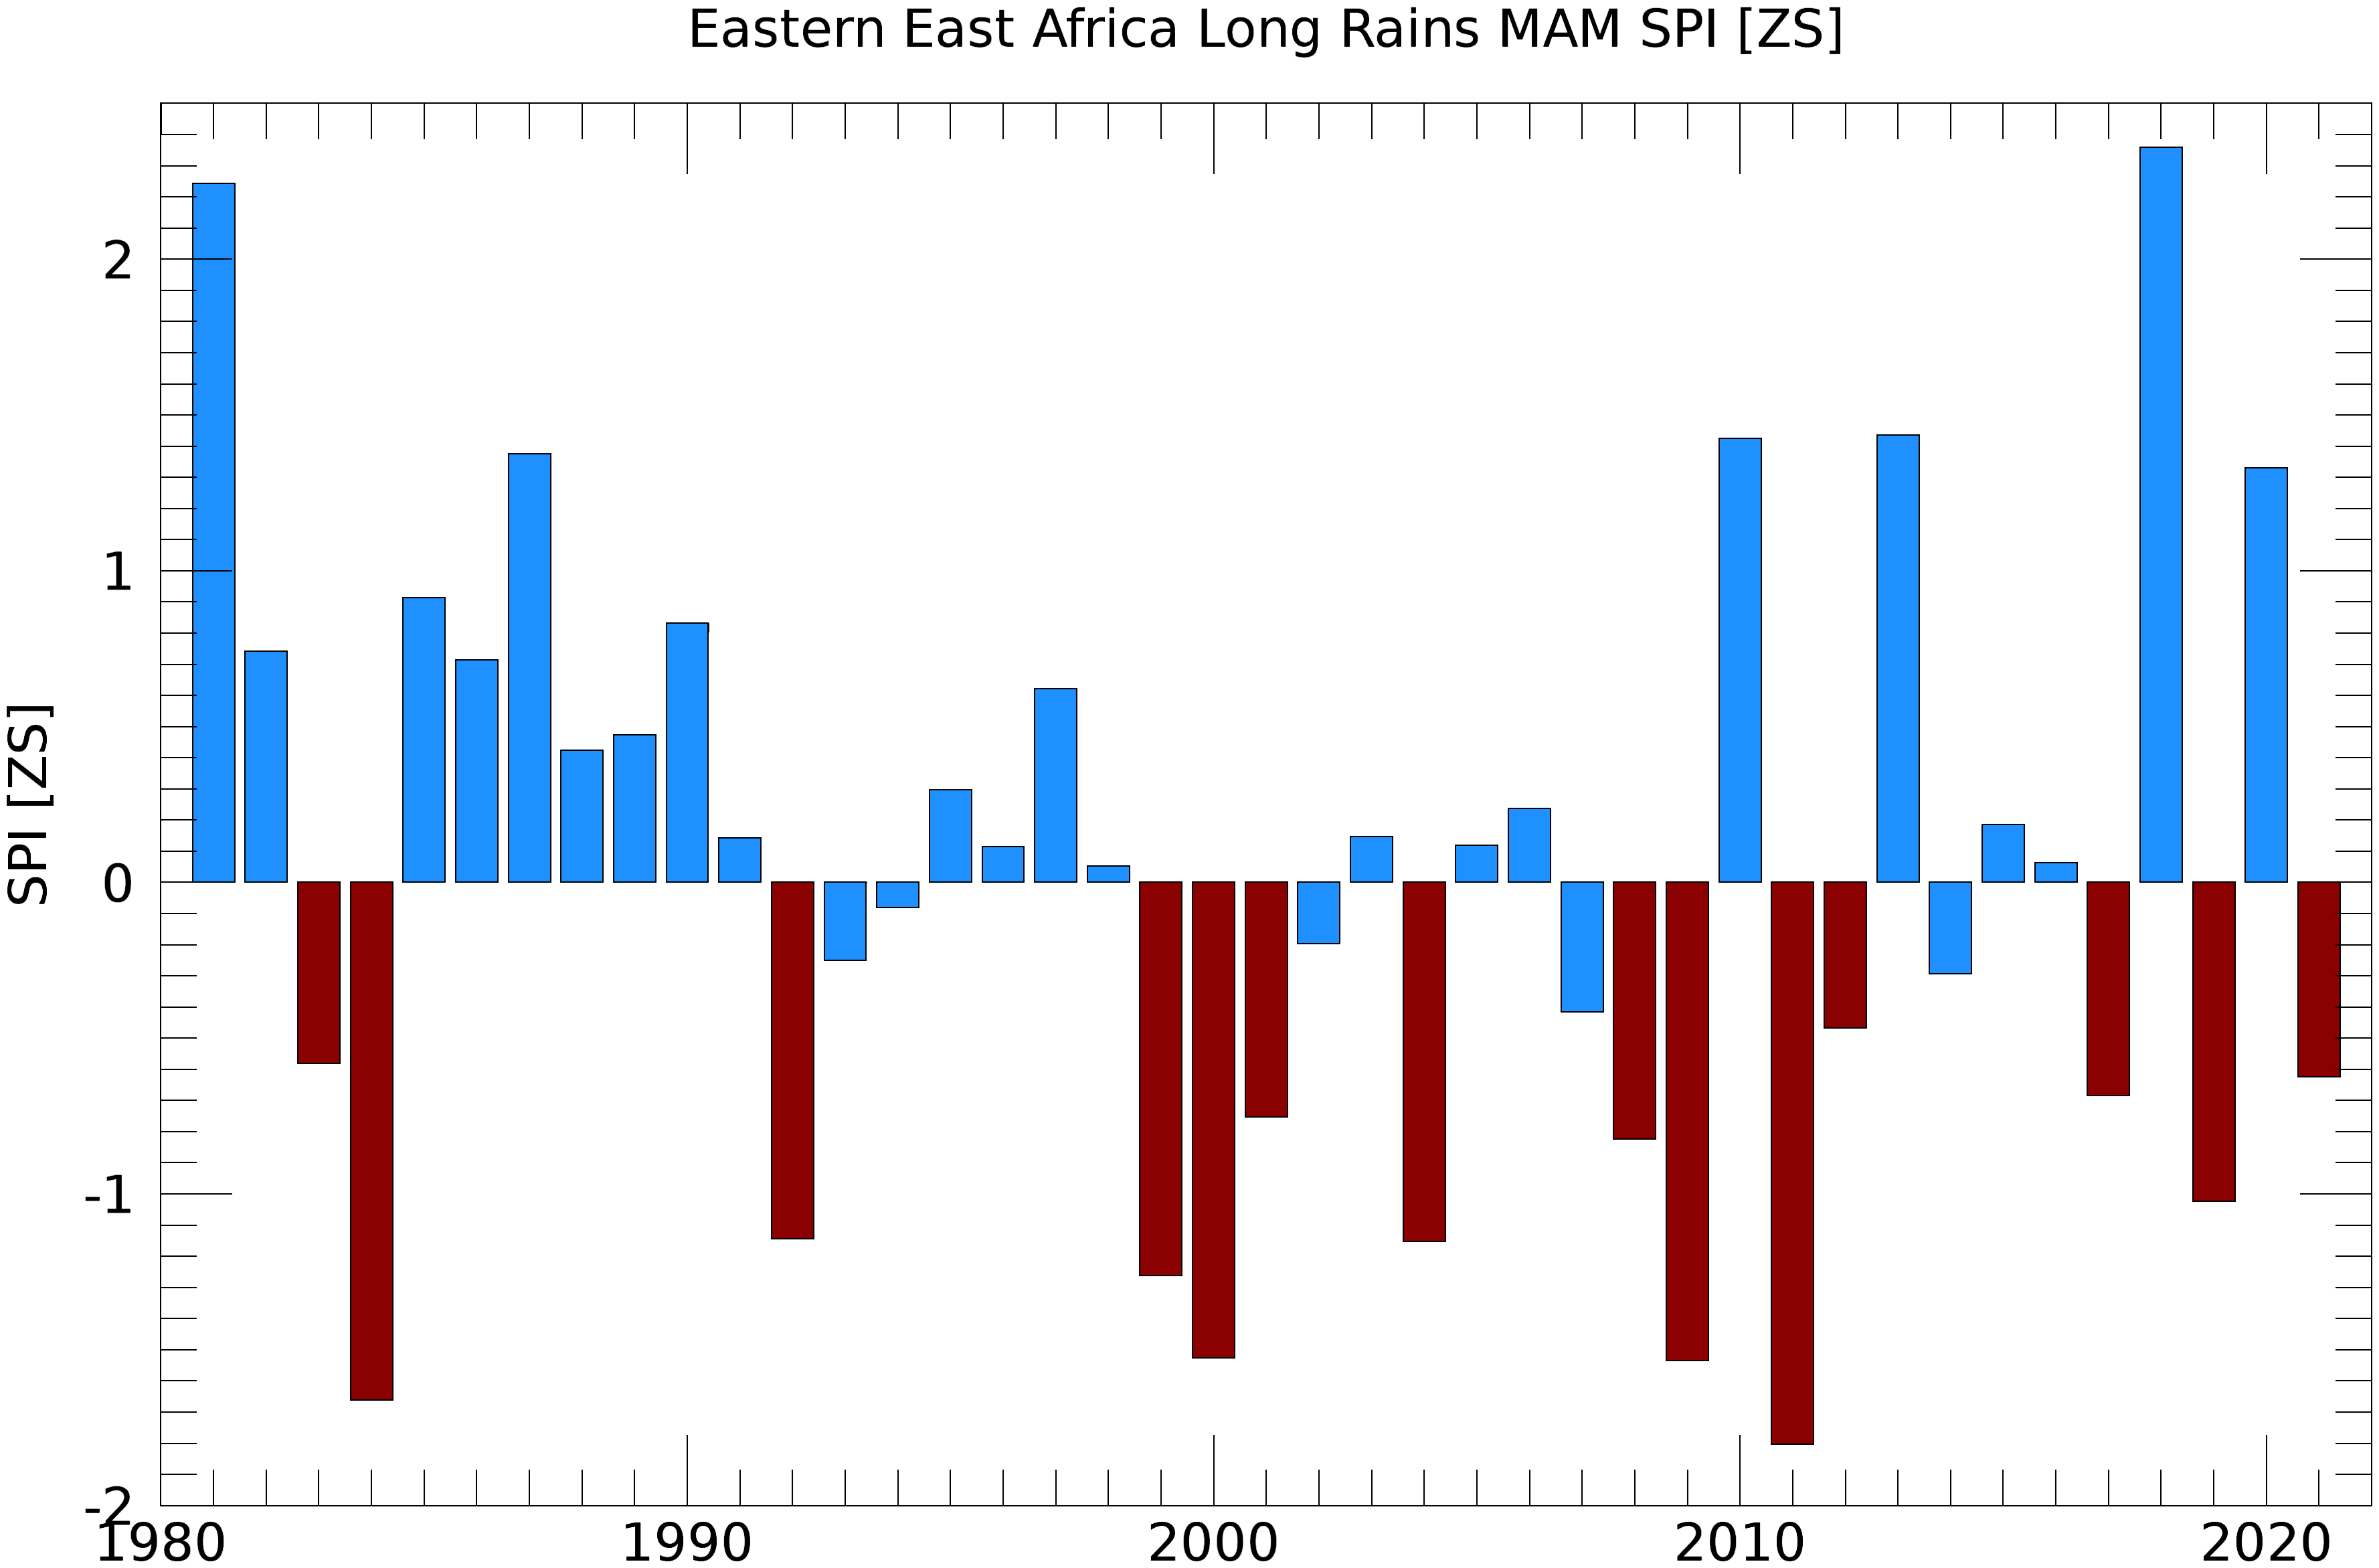
Second, as documented by many studies, dry EHoA MAM rainy seasons have become more frequent. Figure 4 shows 1981-2021 EHoA MAM Standardized Precipitation Index (SPI) values. Since 1999, a stunning 48% of MAM seasons, in 11 out of 23 years, have had below-normal rainfall. According to the Oceanic Nino Index we have also seen a high frequency of La Niña events. Almost half of the 1998 to 2021 OND seasons have been classified as La Niña events. Stronger La Niñateleconnections (Figure 3) and a high frequency of La Ninas can help explain the decline in EHoA rains (Figure 4). But can we predict the events that produce this downward trend?
Tailored Forecasts of EHoA MAM Droughts
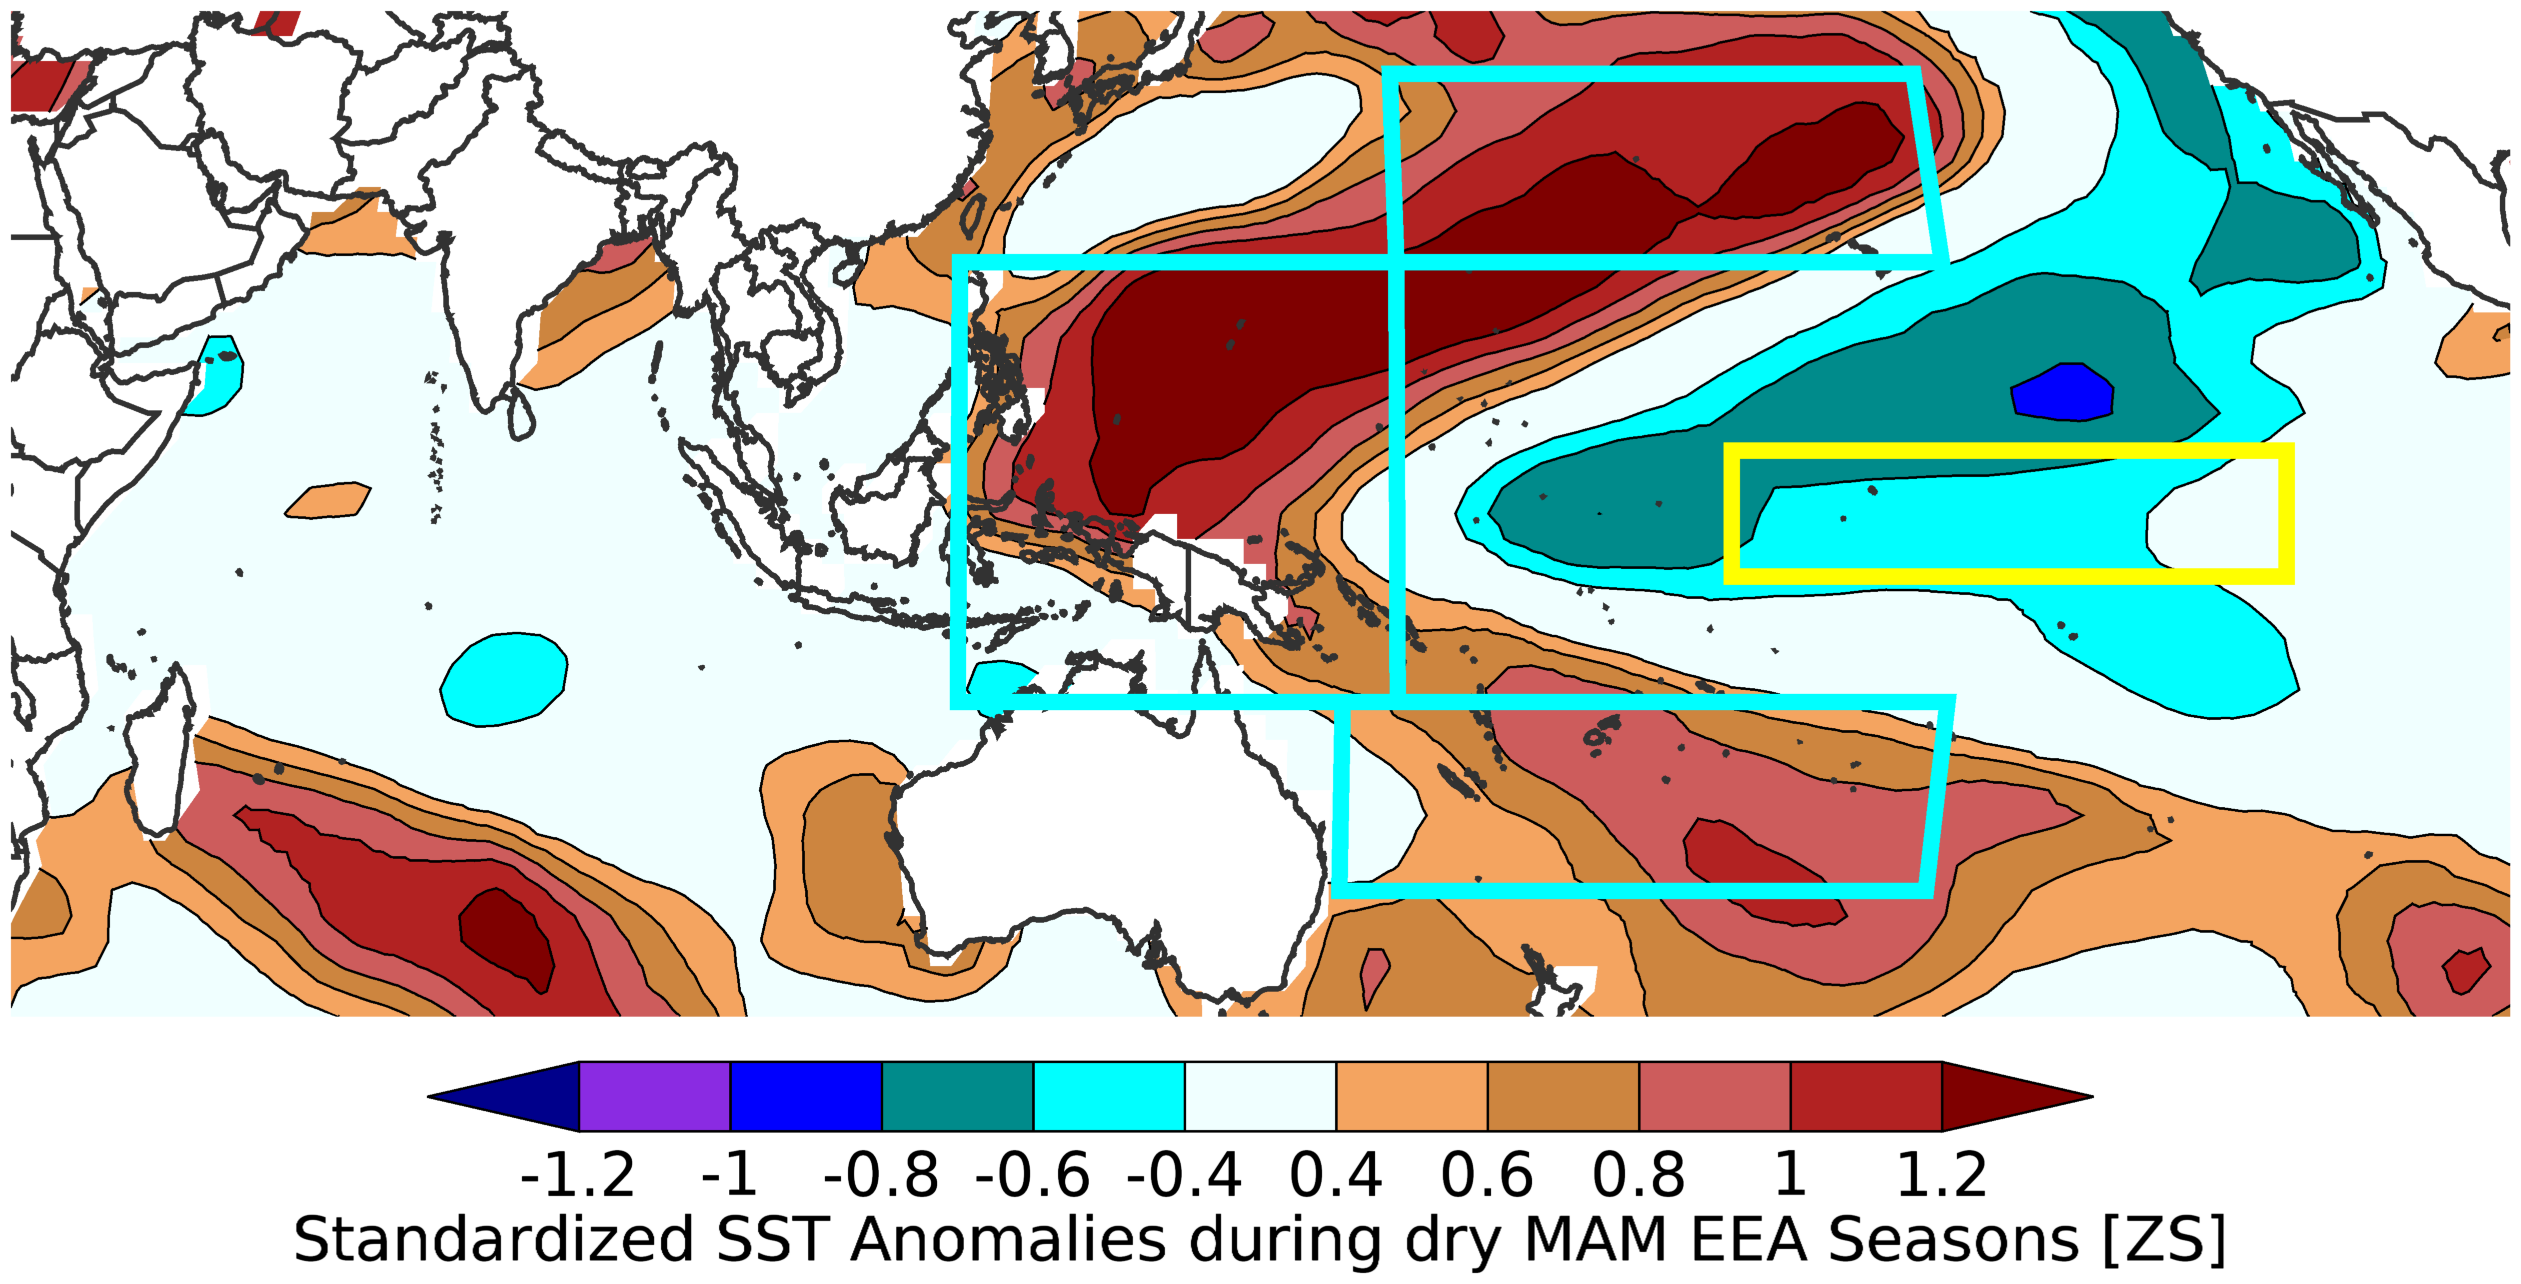
We next develop tailored forecasts of EHoA MAM droughts. A good starting point for such an analysis is a composite map of standardized MAM sea surface temperatures anomalies during post-1998 EHoA dry seasons (Fig. 5). In this figure, we are searching, inductively, for patterns related to potential EHoA drought predictions. While warm southern Indian Ocean anomalies are notable, we focus here on potential opportunities for long-lead prediction and ties to the increased risks associated with La Niña (Figure 3). To that end, we have identified two Pacific ‘hot spots’ - the NINO3.4 region in the East Pacific (yellow rectangles) and the ‘Western V’ region in the western Pacific (cyan rectangles). While the Indian Ocean basin influences certainly play a role in driving variations in East African long rains (McLeod 2019, Wainwright et al. 2019), Pacific Ocean SSTs are much more predictable, and hence more useful from an early warning perspective. As discussed in our 2018 studies (QJRMS, BAMS), in the Pacific, Western V SSTs (blue rectangles Figure 5), also have a very strong warming tendency - with a clear contribution from climate change. Hence, together, the Western V and NINO3.4 describe major contributions from the two major drivers of Pacific SSTs - ENSO and climate change (Funk and Hoell, 2015).
Forecast for MAM 2022
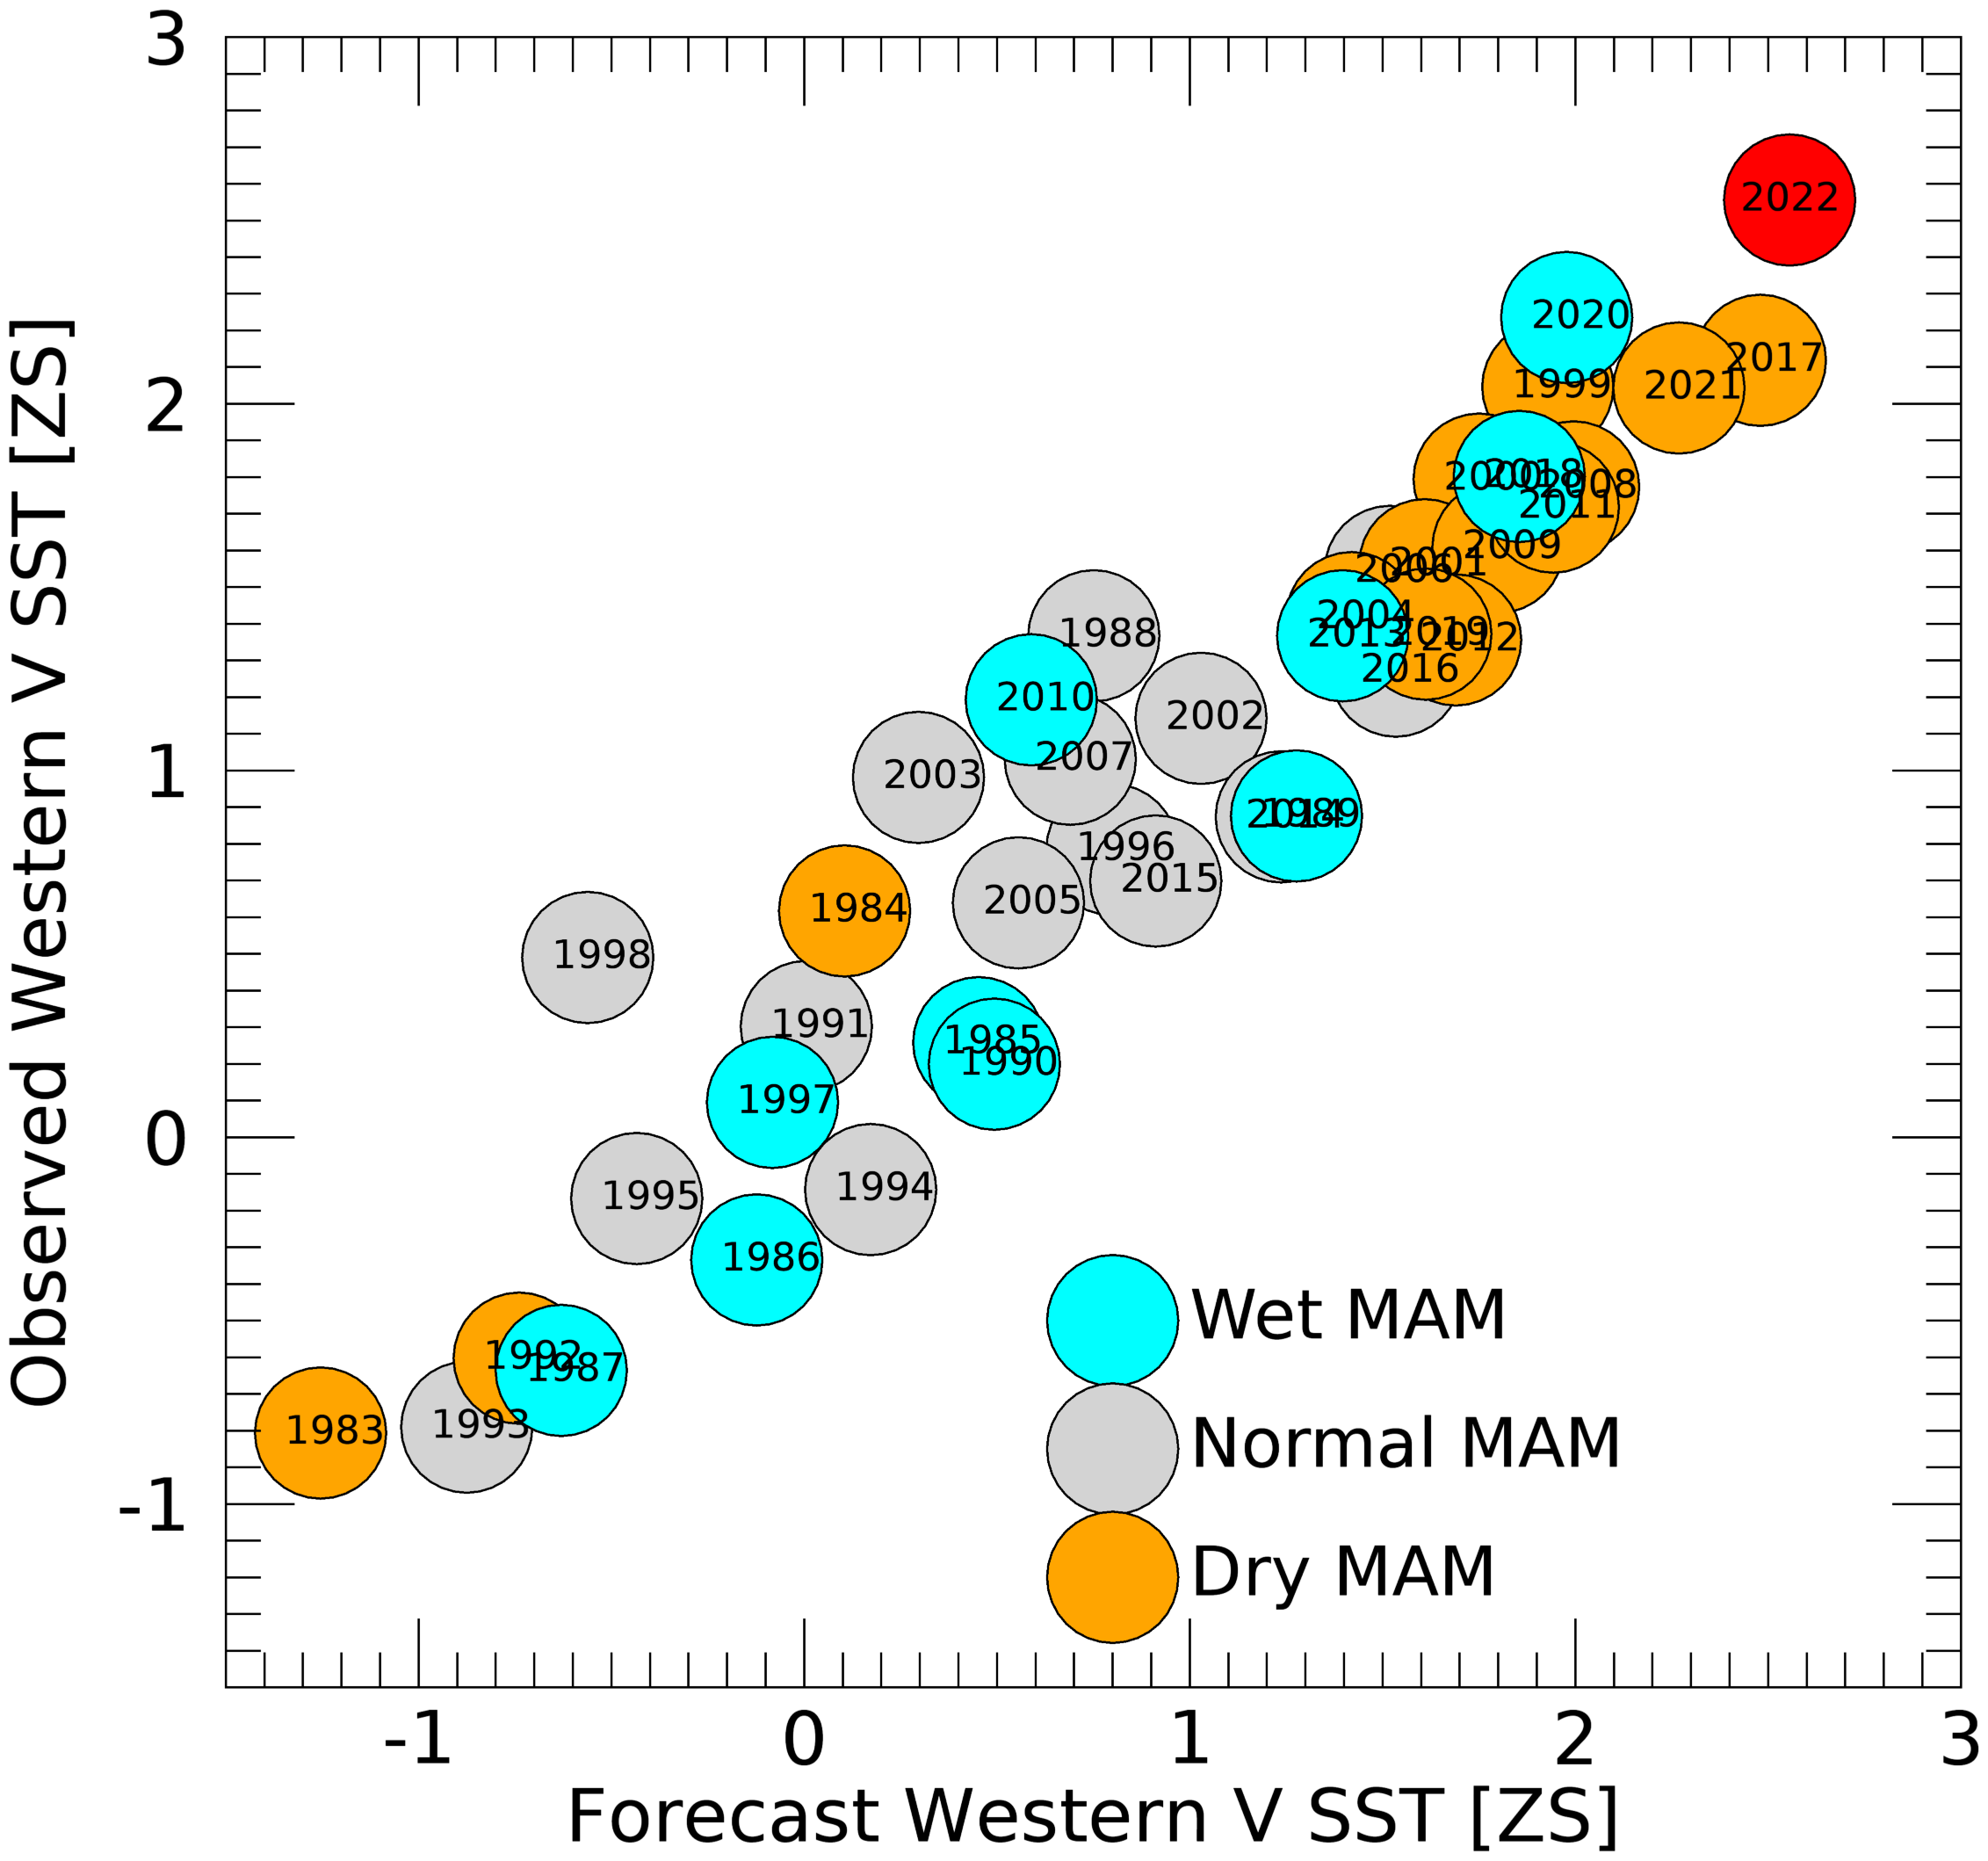
Unfortunately, the current MAM SST forecasts from multiple modeling centers all resemble Figure 5 - suggesting strongly that we are very likely to see Pacific SST conditions similar to prior recent dry seasons. Using the most recent (early March) NMME multi-model SST averages we can examine forecasts of Western V SSTs and the ‘Western V Gradient’ to assess potential risks for MAM 2022. Figure 6 shows forecasts of MAM 2022 Western V SSTs. These forecasts are very skillful, and are suggesting that MAM 2022 Western V SSTs will be incredibly warm, perhaps the warmest on record. Note also that warm Western V SSTs are strongly associated with an increased frequency of below-normal EhoA rainy seasons - we see a strong preponderance of orange circles in the upper-right quadrant of Figure 6. It is also worth mentioning that we also see a few extremely wet seasons (2018 and 2020).
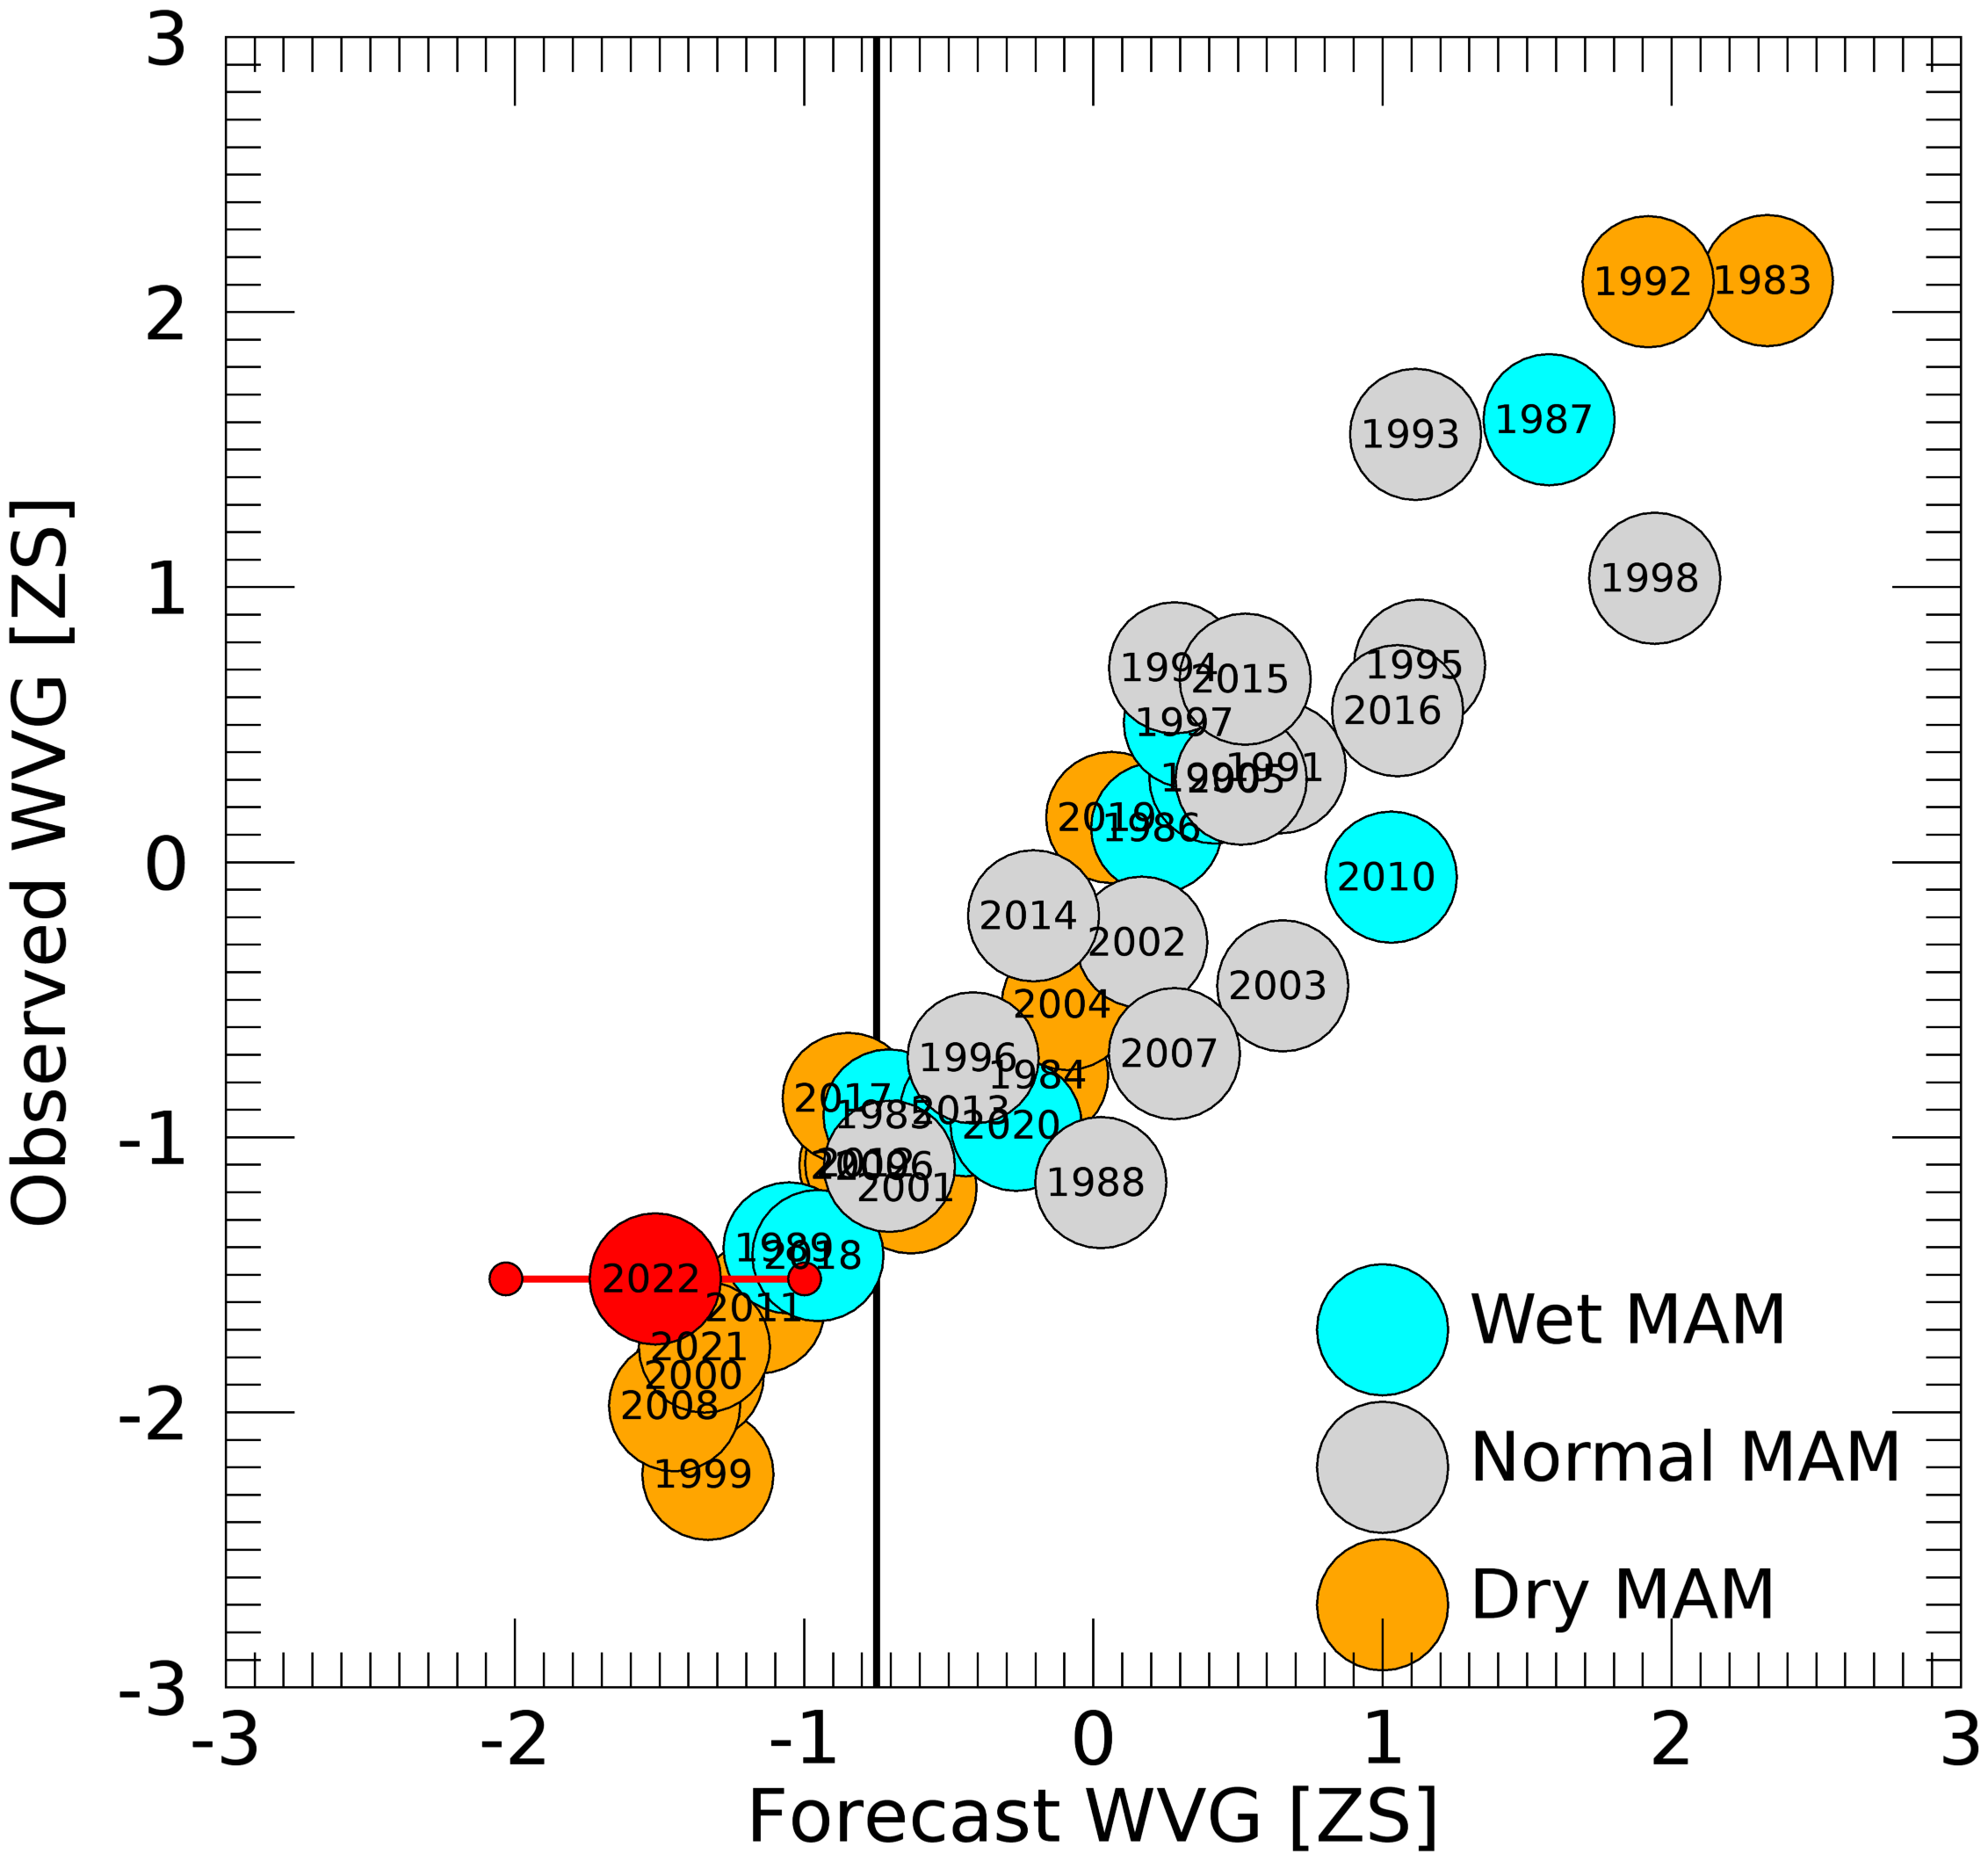
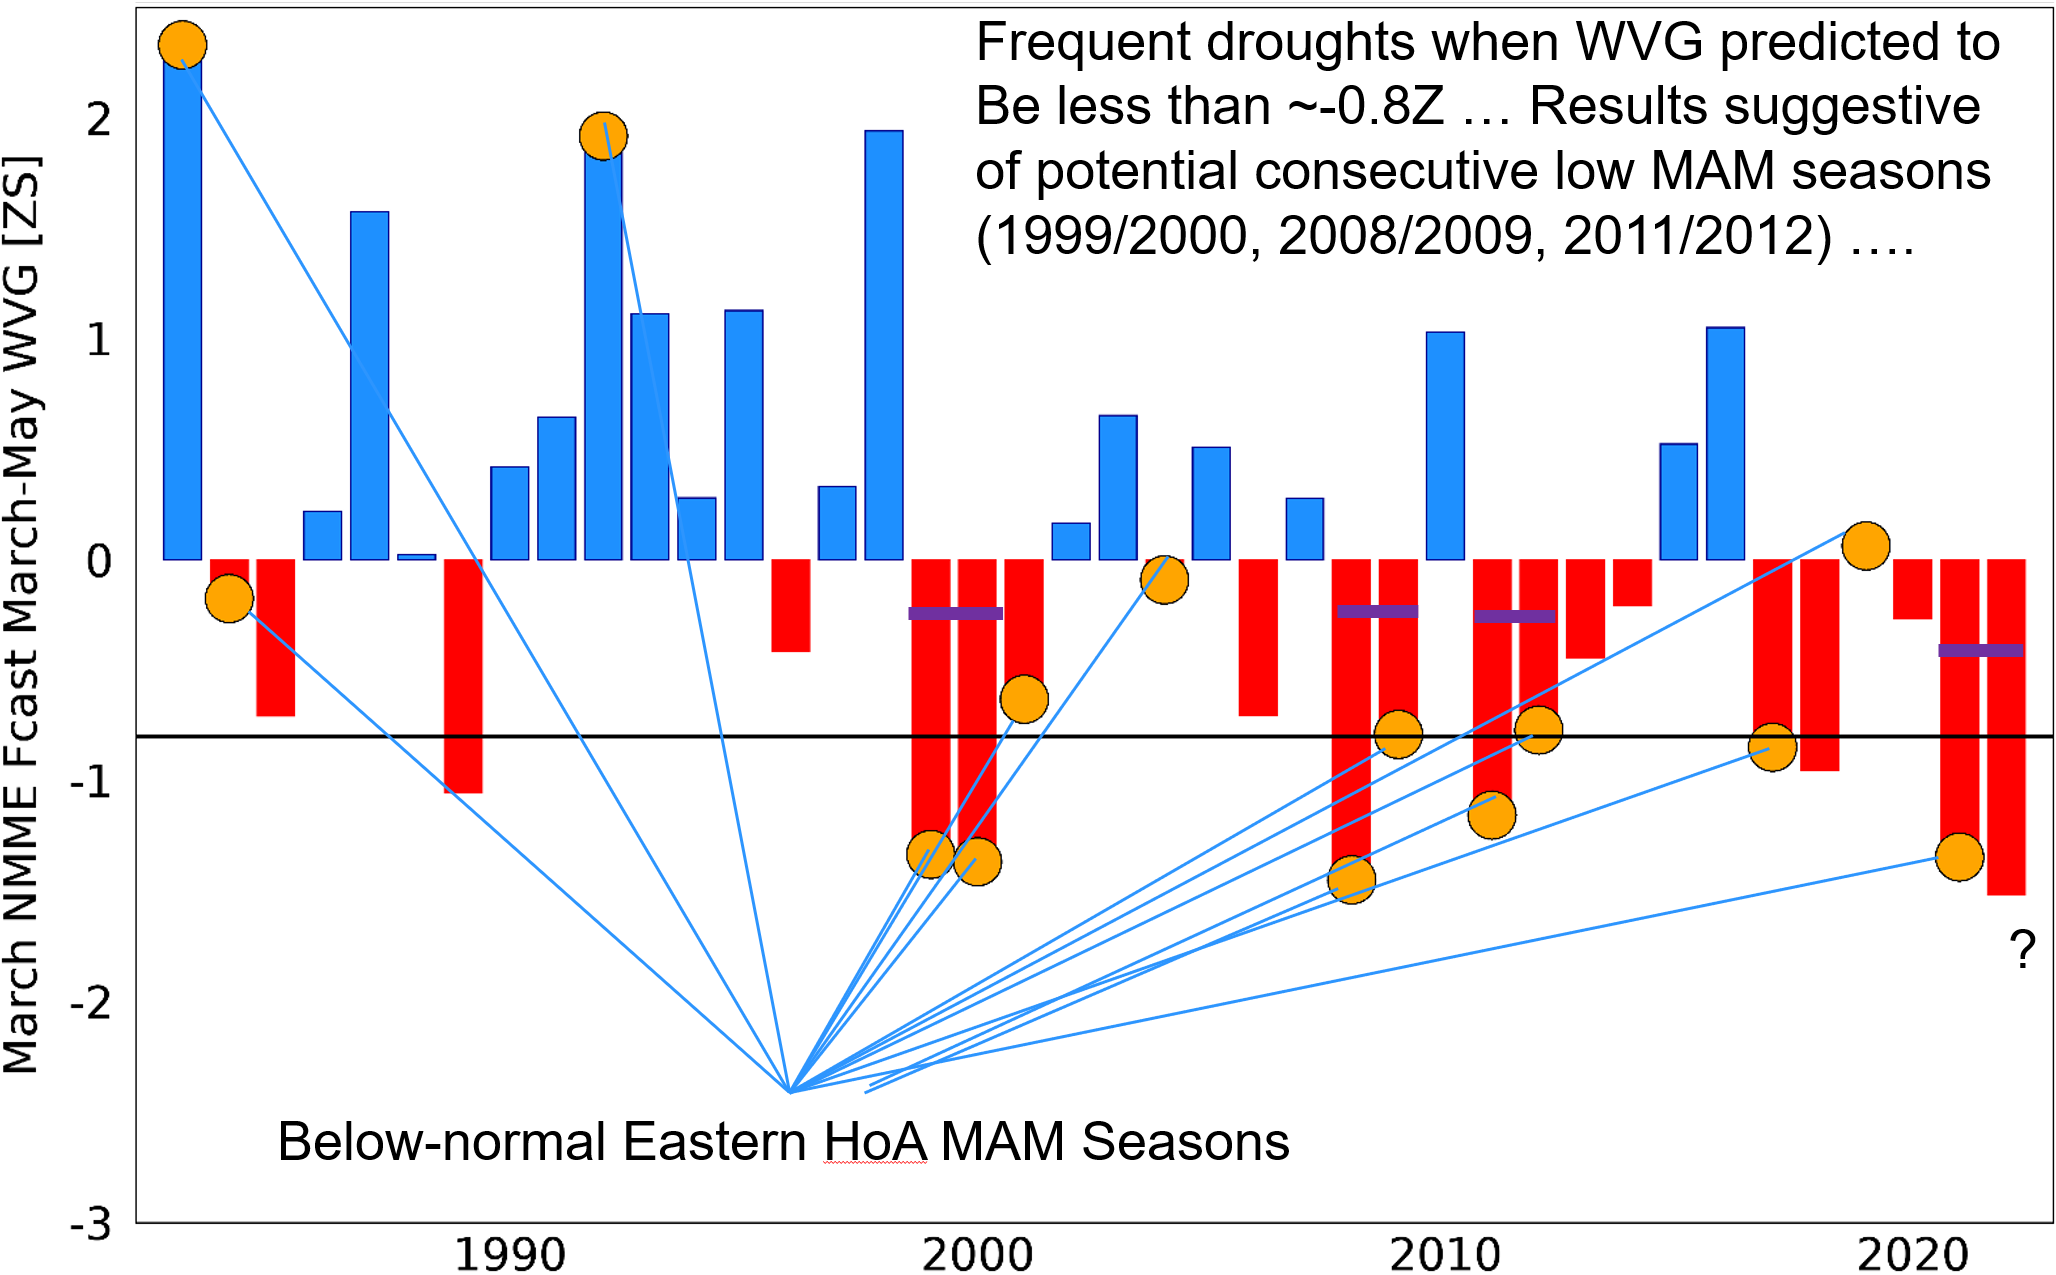
While Western V forecasts do appear to be useful indicators of below-normal MAM rains, prior diagnostic studies have suggested that it is really the interaction between cool La Niña-related east Pacific SSTs (which have strong interannual variability) and warm Western V SSTs (which have a strong decadal anthropogenic influence) that best describe the links between Pacific SSTs, Walker Circulation enhancements, and an increased frequency of below-normal EHoA rainy seasons. To represent these interactions we can use the ‘Western V Gradient’ (WVG) which is based on the standardized difference between NINO3.4 and Western V SSTs. Forecasts and observed WVG values are shown in Figure 7. This is an update of Figure 3c from the multi-agency alert. We also show these same WVG forecasts as a time-series (Figure 8). These results suggest that we are very likely to see strong WVG gradient conditions in MAM. When WVG values have been below -0.8Z we have seen a preponderance of below-normal MAM rainy seasons. During these ten seasons (1989, 1999, 2000, 2007, 2008, 2011, 2012, 2017, 2018, and 2021) EHoA experienced eight below-normal seasons. Furthemore, what we note in Figure 8, for the first time in print, is that there does appear to be a concerning tendency for ‘double-dip’ WVG-related dry MAM seasons, e.g. 1999 and 2000, 2007 and 2008, 2011 and 2012, and (perhaps) 2021 and 2022. This pattern was vehemently not followed in 2018, which was exceptionally wet.
WVG-based maps of dry season counts
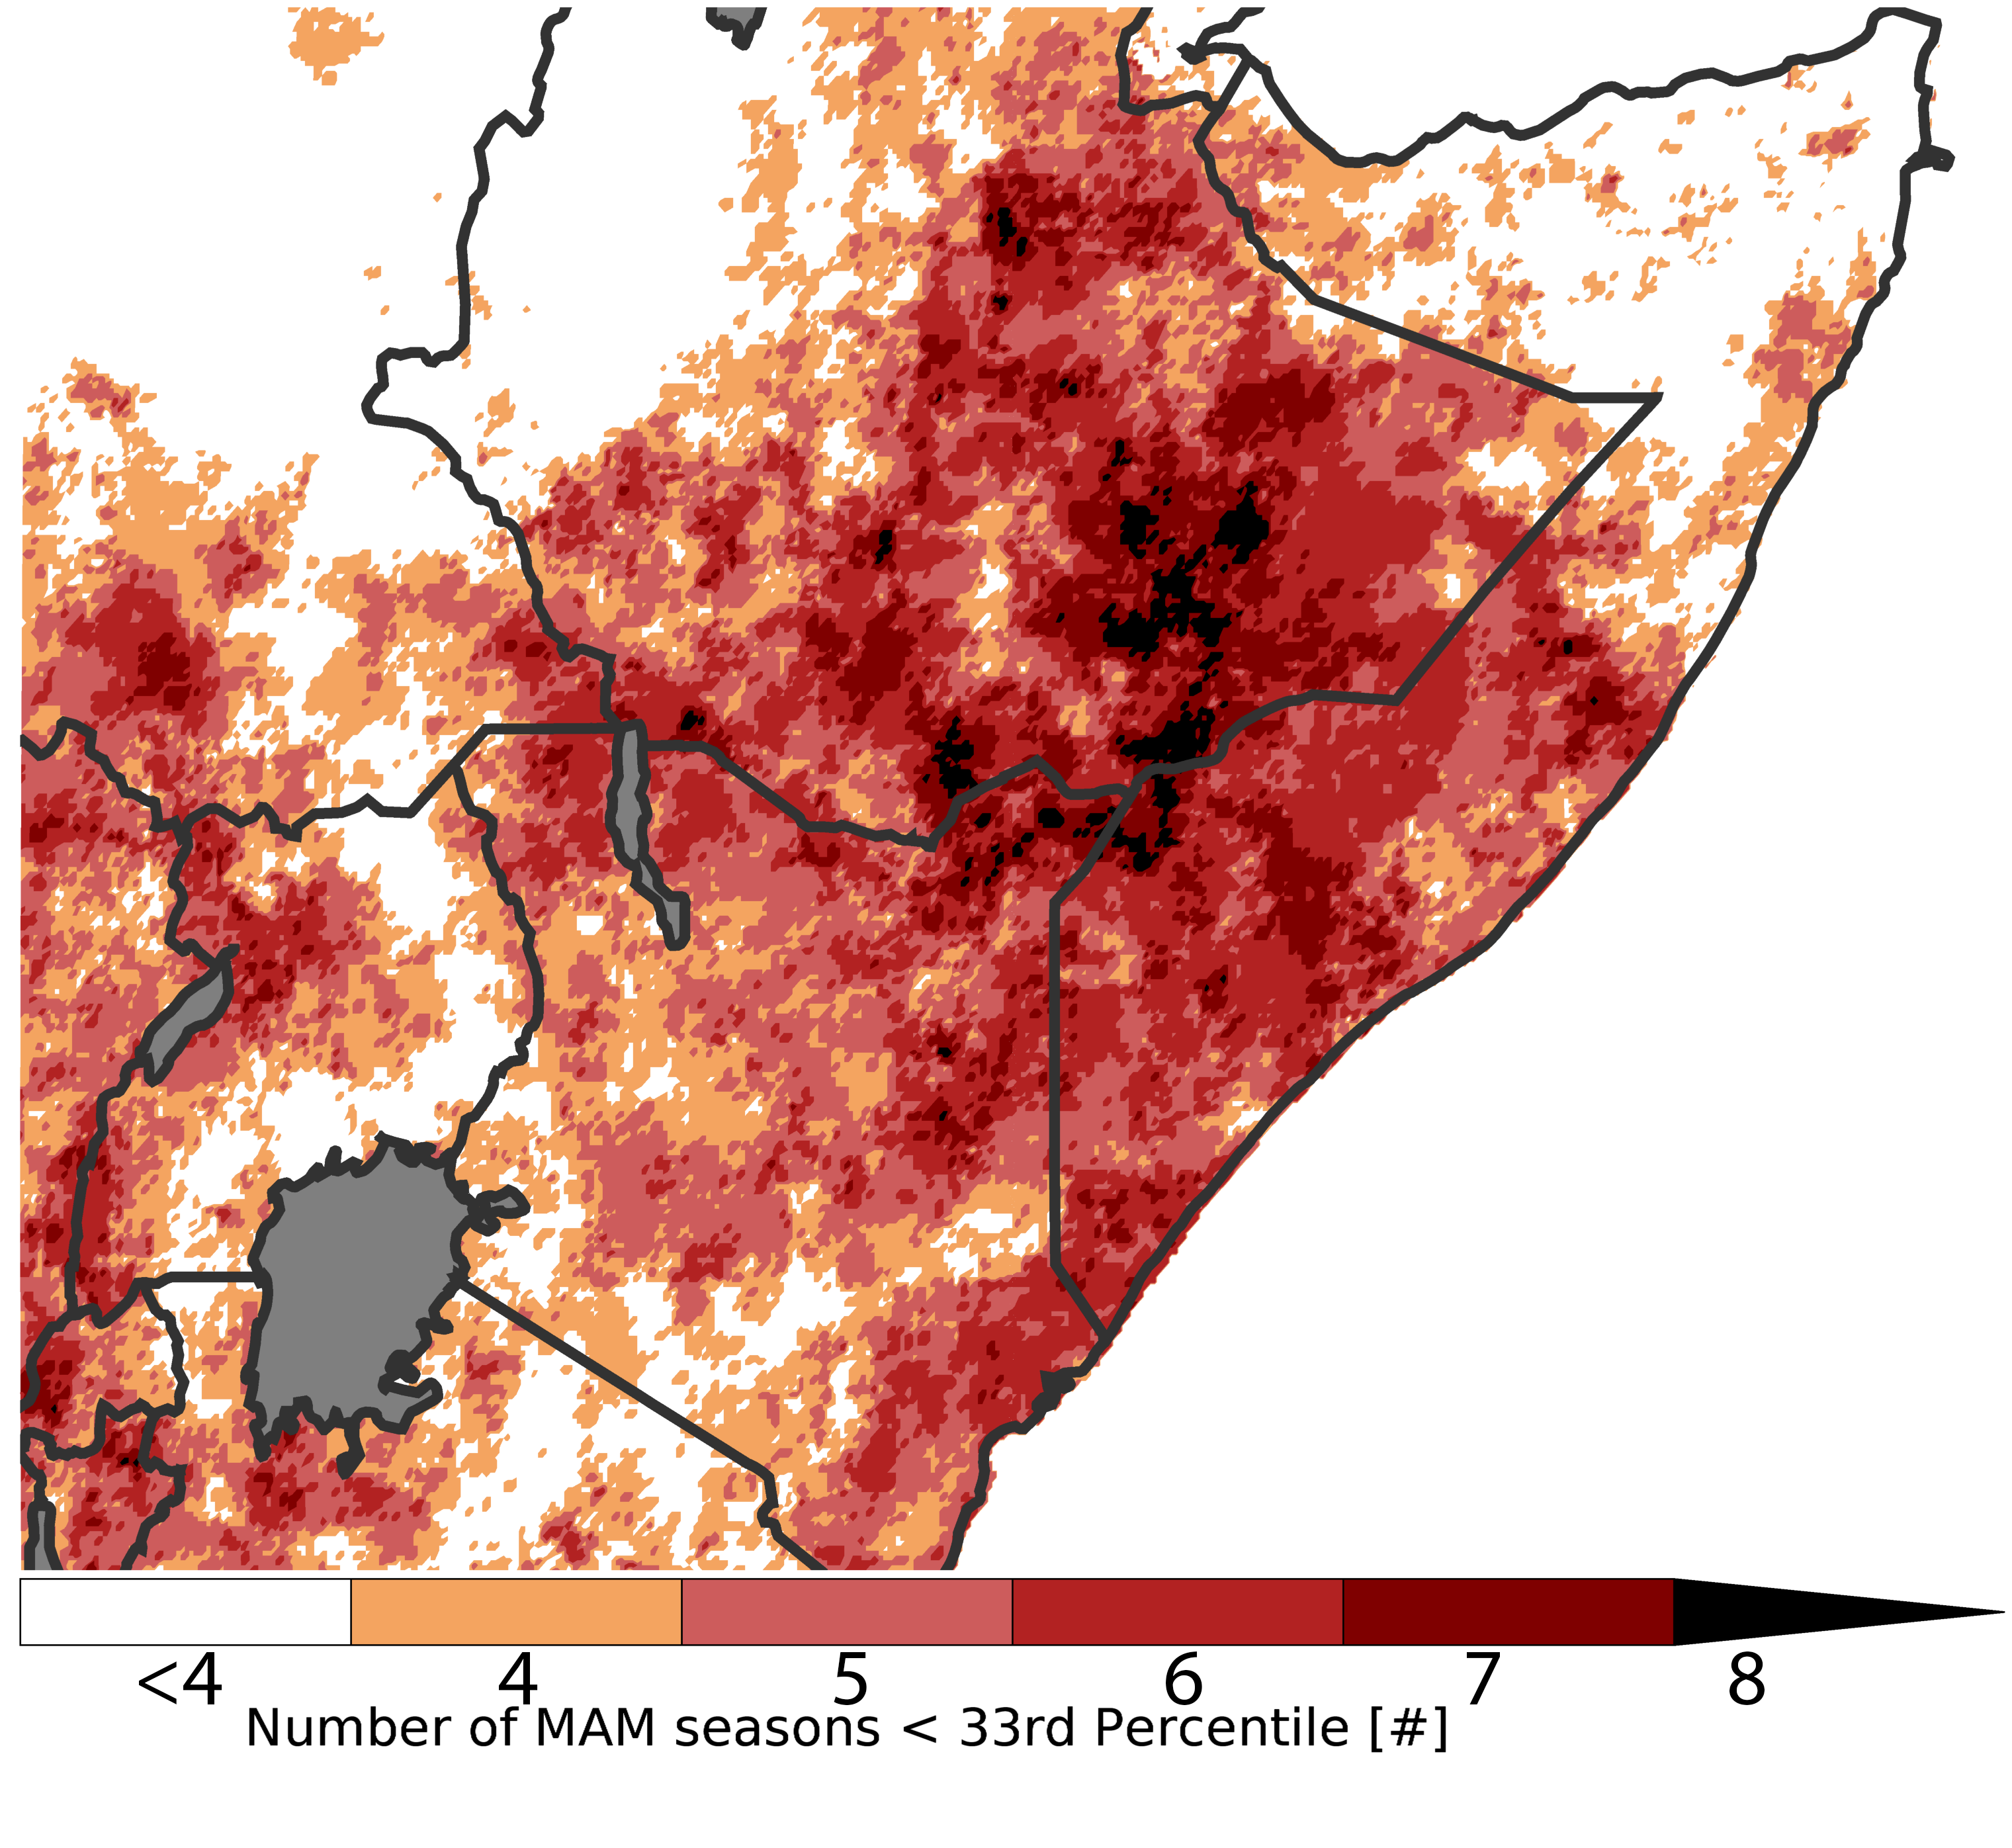
One advantage of the WVG approach is that it provides an evidence-based approach to identifying analog seasons. These analogs can be used with observational data sets to overcome problems associated with mean bias in rainfall fields (Figure 1). This WVG analysis, made just as the 2022 season commences, has given us a large number of analogs (ten), which is useful, because more samples allows us to better capture the inherent spatial variability of individual events. Given that we are very likely to experience negative WVG conditions in MAM 2022, we can explore, inductively, what this may mean by simply counting the number of times each CHIRPS pixel recorded below-normal rains during our ten analog years. These results are shown in Figure 9. The highest probability of dry conditions appears to be south-eastern Ethiopia, where we find many areas with 6-to-8 dry seasons. Southern Somalia also has many areas with 6-to-7 dry seasons. The link to Kenya seems a bit weaker, with 5-to-6 of the analog season having below average rains.
These tailored forecasts leverage climate models’ ability to predict large scale Pacific SSTs very well (Figures 6 and 7), overcoming inherent limitations associated with poor representations of the long rains during MAM (Figures 1 and 2). Unfortunately, the latest forecasts continue to anticipate exceptionally warm Western V SSTs (Figure 6) and strongly negative WVG conditions, which appear related to potential ‘repeat’ below-normal MAM rainy seasons (Figure 8) and elevated chances of yet another poor MAM season Figure 9. The spatial pattern of risk shown in Figure 9 corresponds closely with areas experiencing, now, crisis levels of food insecurity. Of particular concern may be southern Ethiopia, where FEWS NET anticipates emergency food security conditions.